Key points and breakouts
Intermediate · 4 min
Most of a chart is noise. A few prices on it are not — the ones a share has to get through before it can go anywhere. This lesson is about choosing those prices in advance, and about the patience it takes to wait for one to be cleared instead of guessing which way it will go.
You are watching a share that has gone nowhere for months. One morning it moves. Do you buy? Underneath that question is always the same one: is this the start of something, or another twitch on a flat chart? A key point is a way of answering it in advance, instead of arguing with yourself while the price is running.
- key point
- A price you pick in advance that splits strong from weak. Above it you treat the share as strong, below it as weak. The value of it is entirely in having chosen it before your money was involved.
- breakout
- The moment a share closes through a key point instead of turning back at it. Breaking upward through a price that has stopped it before is the event most of this lesson is about.
- consolidation
- A long stretch where a share moves sideways inside a narrow band instead of going anywhere. It can last weeks or months, and most shares spend most of their life in one.
- volume
- How many shares changed hands in a day, drawn as the bars underneath the price on most charts. It tells you how many people took part in a move, not whether the move was right.
Strong above, weak below
That is the whole rule, and it is meant to be blunt. Above your key point you treat the share as strong. Below it you treat it as weak. You are not predicting anything. You are sorting what is in front of you into two boxes, using a line you drew while you were calm.
Where you draw it is your judgement. Most people use a price the share has already struggled with — the top of a long consolidation, or a level that has acted as resistance before. Others use a moving average, or a round number. The choice matters less than the fact that you made it early and then left it alone.
Round numbers make the plainest key points
₹50, ₹100, ₹200, ₹500. Nothing about a round number changes what a company is worth. What it changes is where people put their orders. Targets, exits and alerts cluster on round figures because people think in round figures, and that clustering is enough to make a share pause there. It is a crowd habit, not a law, and it works until the day too many buyers turn up for it to matter.
Why a quiet chart matters before a loud one
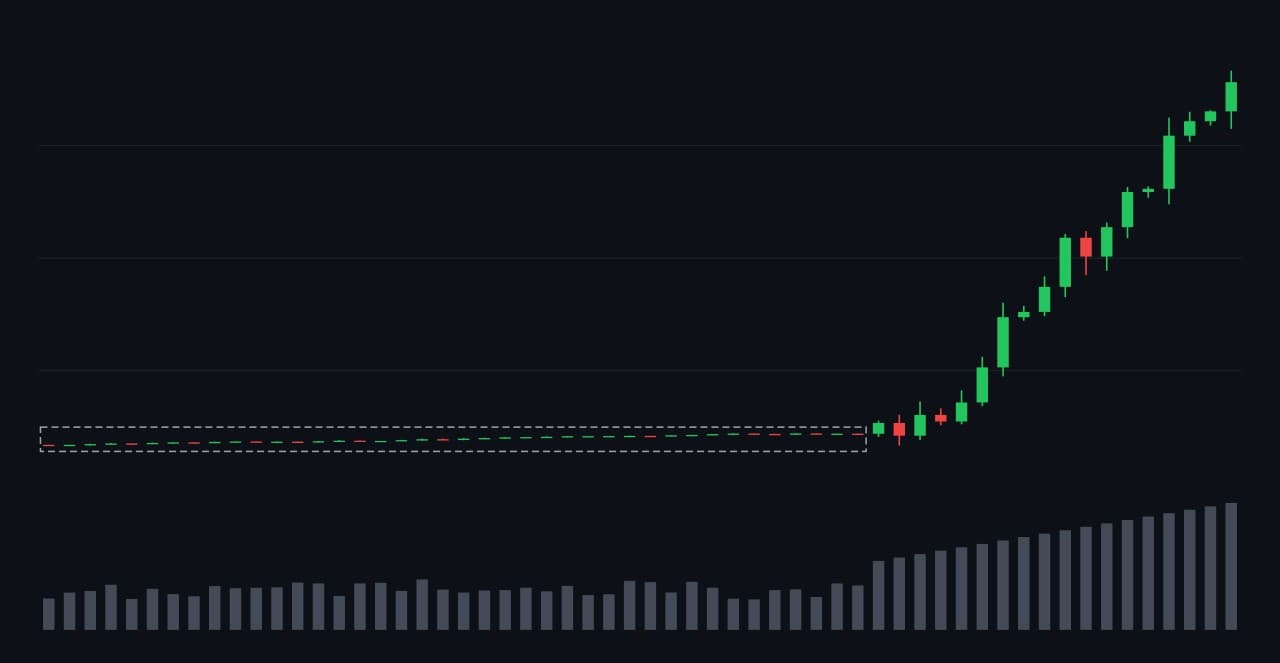
A large buyer cannot buy in a morning. Buying enough of a share to matter takes weeks, and doing it quietly is the point — buying loudly moves the price up against yourself. That is one explanation often given for a long flat stretch on heavy-ish volume: someone patient is accumulating, and the sideways band is what patient buying looks like from outside.
You cannot see who is buying, and you should be honest with yourself that the story above is an interpretation of the chart, not a fact read off it. What you can see is the shape: a long quiet band, then a close above the top of it with far more volume than the share usually does. That shape is what a key point is drawn on.
The time parameter
Shares take their own time. A consolidation that has run four months does not end because you have been watching it for two weeks. Waiting for the close above the line — rather than buying the first move towards it — is most of the method, and it is the part people skip. The cost of waiting is the shares that run away without you. The cost of not waiting is every break that did not hold.
In this topic
A price that pokes above a key point and falls straight back has told you the opposite of what it looked like.
Intermediate · 3 min
What you buy, how much, and when you add are separate decisions the key point does not make for you.
Intermediate · 3 min
Try this in the app
- Research — open a share and find the prices it has stalled at before
Share this lesson
Works with
- Support and resistance — Prices where a share has repeatedly stopped falling, or stopped rising.
- Trends — A share in a trend keeps making higher highs, or lower lows — and most of the time it is doing neither.
- How strong is a level — The same price can be a strong floor or a shaky guess — what actually makes one worth trusting.
- Head and shoulders bottom — Three lows, the middle one deepest, and a line across the bounces between them that the price has to close above.
- Ground volume — When trading in a share dries up to almost nothing, the quiet itself is information.
- Buying after it goes quiet — Three rules people use to act on ground volume, and why none of them tells you the bottom.
- Volume in a pullback — When a rising share dips, how fast its volume shrinks is read as a sign of how the dip will end.
- Making a hammer believable — A hammer at a price the share has turned at before, on heavy volume, says more than one in empty space.
- The hanging man — A small body on a long lower wick, after a rise — the same shape as a hammer, in the opposite place.
- Dark cloud cover — A strong up day, then a strong down day that cuts deep into it — the deeper the cut, the more attention it gets.
- Bearish engulfing — A red candle that swallows the green one before it completely — the bigger the swallow, the more attention it gets.
- Where to put the stop — Put it where the reason you bought stops being true.
- When a tip is dressed up as analysis — A pitch that shows you arithmetic and charts can still be a sales pitch, and the arithmetic proves nothing.