Dark cloud cover

Intermediate · 3 min

A strong up day, then a strong down day that cuts deep into it — the deeper the cut, the more attention it gets.

A share has been rising, and one day puts in a big green candle that looks like confirmation buyers are firmly in charge. Then the next day opens even higher — and closes down hard, cutting back into the gain the first day made.

dark cloud cover
Two candles after a rise: a large green candle, then a red candle that opens above the green candle's close and closes back down inside the green candle's body — at least halfway into it. The deeper the red candle cuts, the stronger the pattern is taken to be.
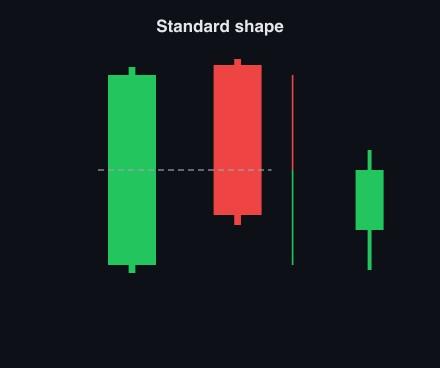
A diagram labelled 'Standard shape': a tall green candle, then a red candle that opens above the green candle's close and closes well below a dashed line marking the green body's midpoint, with a red arrow measuring the cut from the top and a green arrow measuring the remainder to the bottom. A small separate green candle sits apart on the right.
The measure that matters: how far the second candle's close falls back into the first candle's body, compared with the first candle's full height.

The rule traders use is fifty percent: the red candle's close has to come back down through the midpoint of the green candle's body. Short of that, the pattern has not really formed, and the most it is worth doing is watching the next day a little more closely.
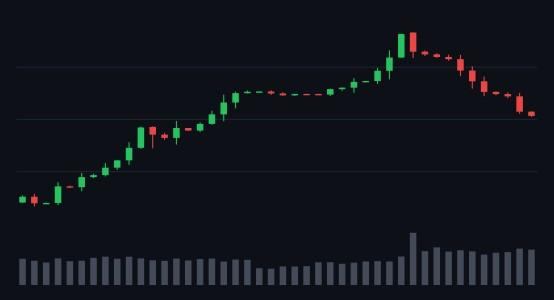
A daily chart where a green-then-red candle pair appears twice, weeks apart. The first time the red candle's close barely dents into the green candle's body and the price keeps climbing to a second high. The second time the close cuts deep into the body, the volume bar underneath grows taller, and the price turns down and falls.
The same two-candle shape appears twice, weeks apart. The first time the close barely dents the body and the price keeps climbing. The second time it cuts deep, volume rises, and the price actually falls.

The same chart gives both outcomes a few weeks apart. The first time the shape appeared, it fell short of halfway and the rise continued into a second, higher top. The second time, the cut was deep and volume picked up with it — and that time the price gave way.
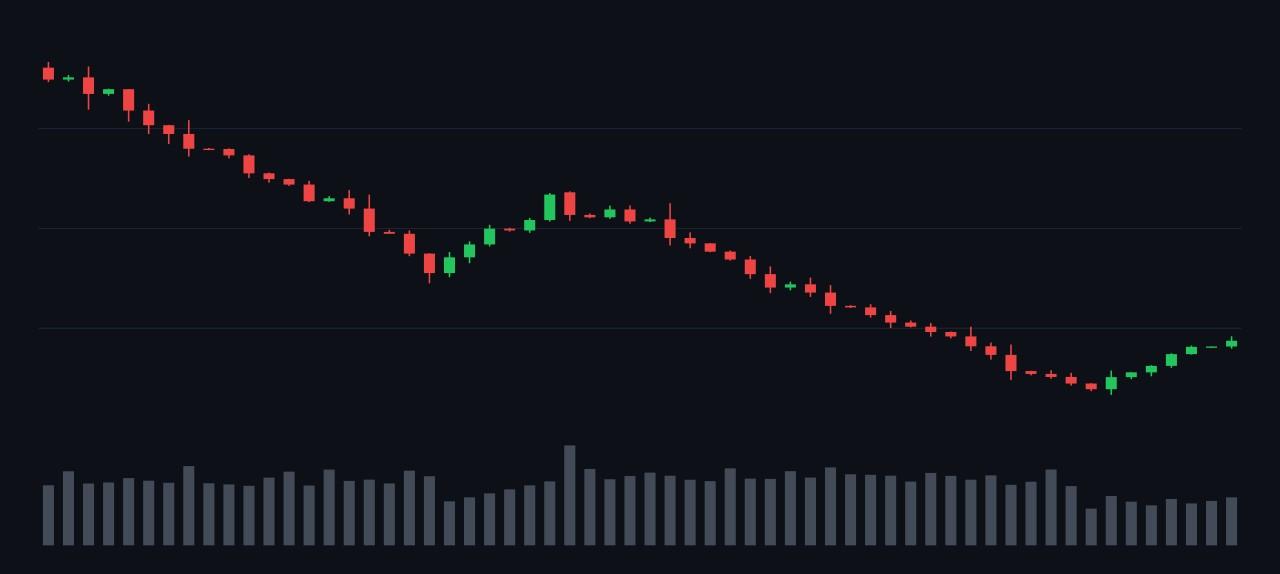
A daily chart of a long, gradual decline interrupted by a brief sharp spike upward. Right at the top of the spike, a tall green candle is immediately followed by a red candle whose close cuts deep into its body. The price resumes falling for a long stretch afterward, then stages a partial rally later in the chart.
A clean case: the red candle cuts deep into the green one right at the top of a sharp spike, and the price falls for a long stretch afterward.
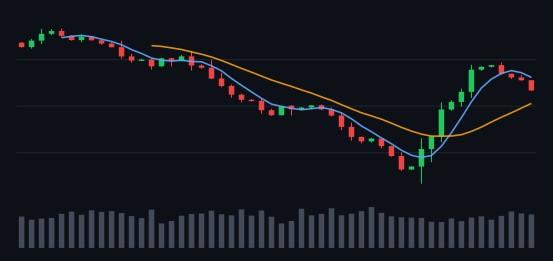
A daily chart with two curved moving-average lines running through the candles. From a peak the price falls in uneven stages over several months, with a couple of loose, partly-formed green-then-red pairs along the way. It reaches its lowest point roughly two-thirds of the way across, then rallies back up to briefly touch a price level it fell from earlier before turning down again.
The pattern never fully forms, but the closes keep coming in lower day after day, and the price falls until it rallies back to briefly touch a level it fell from earlier, then stalls again.

This chart is worth sitting with. The two-candle shape alone was never textbook, but each day after it kept confirming the same thing: sellers winning the close. A share can give you weaker evidence than the named pattern and still be telling you something, provided you keep watching rather than waiting for a perfect shape.
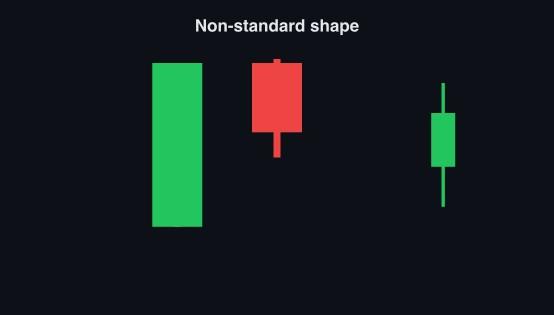
A diagram labelled 'Non-standard shape': a green candle and a red candle of matching height sitting side by side with their tops level and no gap between them, the red candle's close still cutting deep into the green candle's body. A separate thin green candle sits apart on the right.
A looser version: the second candle opens level with the first candle's close, with no gap up at all, but still cuts deep enough into the body to count.
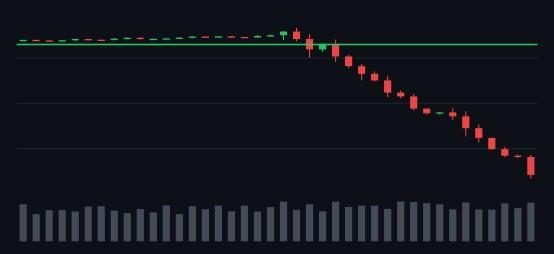
A daily chart with a horizontal green line drawn across a price level the chart traded either side of for a couple of months. The price later falls away below that line in stages, and the line stays visible above the candles for the rest of the chart.
This looser version formed near a price the chart had already struggled to hold, and the fall that followed carried well below it.

A gap up at the open is common but not required. What has to be true is the close: well back down inside the first candle's body. A version without the gap that still cuts deep counts the same as the textbook shape.

Share this lesson

Works with

  • Key points and breakouts — Some prices matter more than the rest, and a share that clears one is telling you something.
  • Candles that warn of a top — Three single-day shapes that show buyers losing control near a high — and the rule that confirms any of them.