Bearish engulfing

Intermediate · 3 min

A red candle that swallows the green one before it completely — the bigger the swallow, the more attention it gets.

A share has been rising, and one day a red candle opens at or above the previous day's close — then closes below the previous day's open, undoing the whole of the prior day's gain in a single session.

bearish engulfing
Two candles after a rise: a green candle, then a red candle whose body completely covers it — the red candle's open is above the green candle's close, and its close is below the green candle's open. Only the bodies have to be engulfed; the wicks do not.
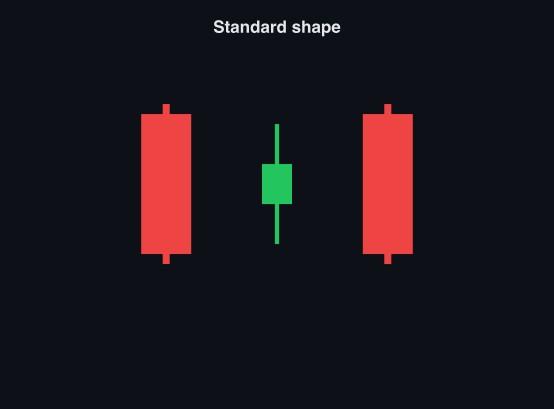
A diagram labelled 'Standard shape': a small green candle with wicks on both ends, between two tall red candles whose bodies reach above and below the green candle's full range on both sides.
The red candle's body reaches above and below the green candle's body on both sides. A bigger gap between the two closes is read as a stronger version of the same shape.

The bigger the fall and the heavier the volume on the red day, the more seriously the shape is taken. A red candle that only just covers the green one, on thin volume, is a weak version of the same idea and worth far less.
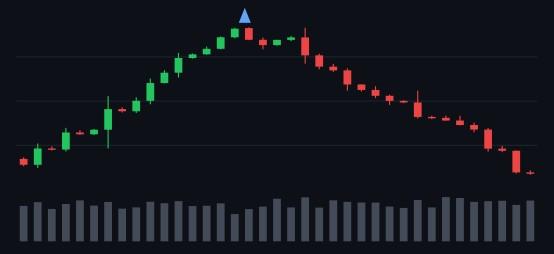
A daily chart climbing to a high, with a blue arrow marking a green candle immediately followed by a red candle whose body completely covers it, right at the peak. The price falls steadily for a long stretch after this pair.
The engulfing pair forms near a high, the next candle opens and closes lower again, and the price falls steadily for a long stretch afterward.
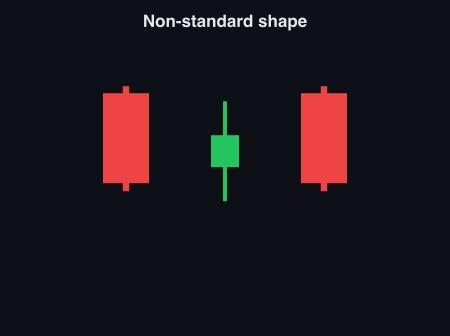
A diagram labelled 'Non-standard shape': a green candle with wicks on both ends, next to two tall red candles whose tops reach the green candle's top but whose bottoms stop short of the green candle's lower wick.
A looser version: the red candle's top still reaches the green candle's top, but its bottom stops short of the green candle's lower wick. The bodies are still fully covered, which is what the rule actually asks for.

The rule is about the bodies, not the full candle. A red candle whose body swallows the green candle's body counts, even if its wick does not reach as far down as the green candle's own lower wick.
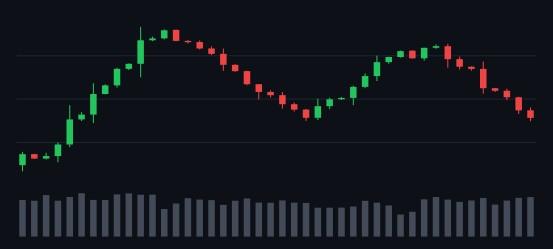
A daily chart where an engulfing pair forms near a high point, the price falls, then rallies back up close to that same high without quite reaching it, printing a smaller, looser version of the same green-then-red pair there before resuming its fall.
The pattern forms near a high, and the fall that follows is only briefly interrupted by a rally that stalls just under the same high — where a second, looser version of the same shape forms.

A single engulfing pair is not always the end of the story. Here the rise tried to come back once, failed to clear the price it had reached before, and printed a weaker version of the same shape on the way back down.
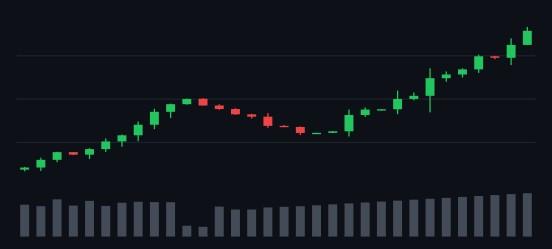
A daily chart partway along a climb, with a green candle immediately followed by a red candle whose body fully covers it, the volume bars underneath that pair noticeably shorter than the bars around them. The price dips briefly afterward, then climbs back up through to a new high by the right edge of the chart.
A similar pair forms on noticeably thin volume. The price dips for a short stretch, then climbs straight through to a new high — the fall that the shape seemed to promise never arrived.

This is the weak version doing what weak versions do. The volume was thin, so there was less behind the shape to begin with, and the short dip that followed was the whole of the reaction. Reading the shape without reading the volume would have missed that it was never a strong signal.

Share this lesson

Works with

  • Candlestick charts — Each candle packs a whole day of trading into one shape.
  • Key points and breakouts — Some prices matter more than the rest, and a share that clears one is telling you something.
  • Candles that warn of a top — Three single-day shapes that show buyers losing control near a high — and the rule that confirms any of them.