The hanging man
Intermediate · 3 min
A small body on a long lower wick, after a rise — the same shape as a hammer, in the opposite place.
A share has been rising for a while. Then one day the price is pushed down hard during the session, and buyers take almost all of it back before the close. On the chart that day leaves a small body sitting on a long lower wick — the same shape a hammer makes, but after a rise instead of a fall.
- hanging man
- A candlestick with a small body near the top of the day's range, a lower wick at least twice as long as the body, and little or no upper wick. It only counts as a hanging man when it comes after a rise. The body can be either colour.
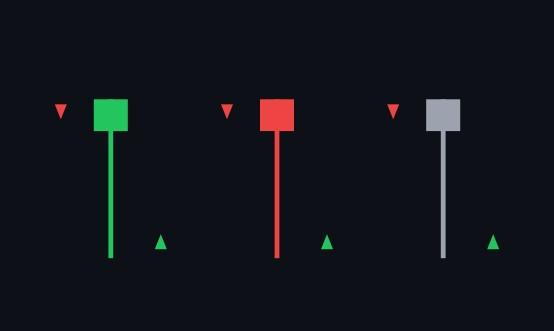
A green body means buyers edged it, a red body means sellers did, and a T-shape with almost no body means the two sides fought to a draw. The colour matters less than the long lower wick underneath: it shows sellers drove the price down hard and buyers bought enough of it back to erase most of the fall.
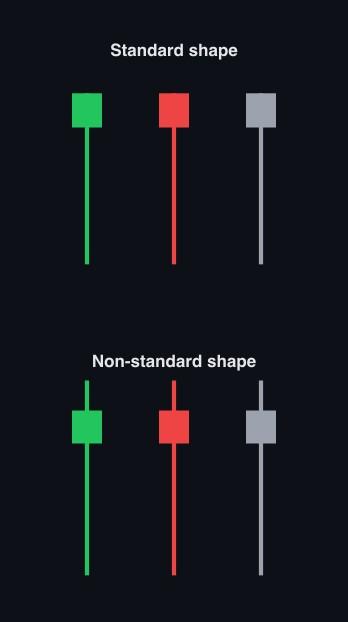
A long upper wick as well would mean sellers also won part of the day at the top, which muddies the story. The cleanest hanging man has almost no upper wick — buyers held the top of the range, and the only fight left was over how much of the fall they could buy back.
Confirming it
A hanging man by itself only says the day's fight was close. Confirmation is the next day closing below the hanging man's body — if the share trades down through where the hanging man opened and closed, anyone who bought near those prices is now sitting on a loss, and that is what tips the balance toward sellers.
Volume adds weight to either reading. Heavy volume on the hanging man or the day after means a lot of people changed their mind at once. Volume that shrinks instead means wait for another day before taking the shape seriously.
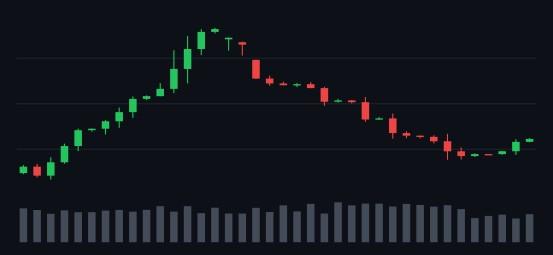
This is what a confirmed one looks like: the shape at the peak, a lower open the next day, and a fall that actually follows. It is also one chart, picked because it worked. Plenty of hanging men come and go without anything like this happening.
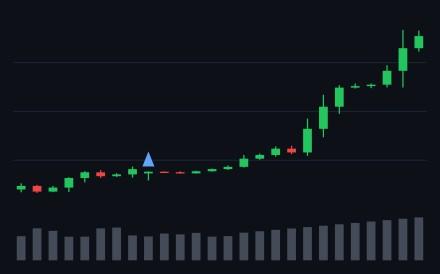
This is the other outcome, and it is the more common one. The shape was there, but the close that would have confirmed it never came, and the rise simply continued. Reading only the shape and not what follows it would have called this one wrong.
Share this lesson
Works with
- Candlestick charts — Each candle packs a whole day of trading into one shape.
- The hammer candle — A small body on a long lower wick, after a fall — and why one candle is never the whole story.
- Key points and breakouts — Some prices matter more than the rest, and a share that clears one is telling you something.