The hammer candle
Intermediate · 3 min
A share has been falling for weeks and you want to know where the floor is. The hammer is the candle people most often point to as the answer. This lesson covers what one looks like, the rules that make it count, and what to wait for before you act on it.
A falling share is hard to watch. Every day you wonder whether this is the bottom. Then one day the price drops sharply in the morning, and by the close it has climbed almost all the way back. On the chart that day leaves a small body on top of a long tail. Traders call it a hammer, and it is one of the most quoted candles there is.
- hammer
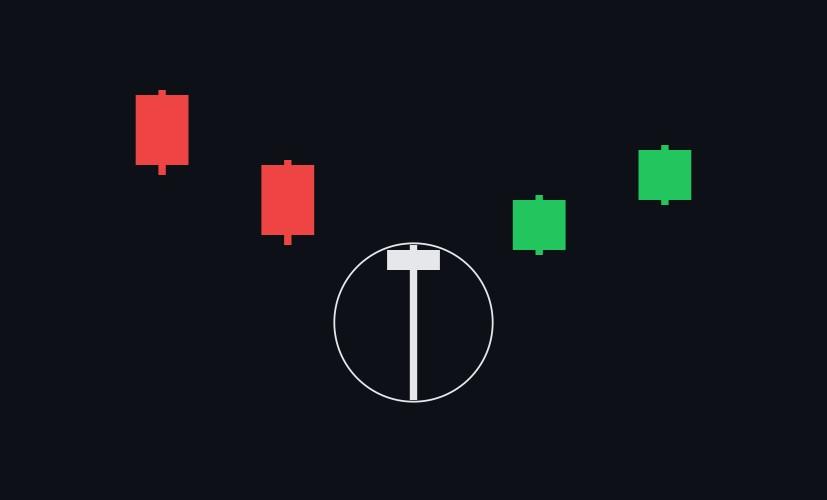
- A candlestick with a small body near the top of the day's range, a lower wick at least twice as long as the body, and little or no upper wick. It only counts as a hammer when it comes after a fall. The body can be either colour.
- inverted hammer
- The same shape upside down: a small body near the bottom of the range and a long upper wick, after a fall. Buyers pushed the price up during the day but could not hold it. It is read as a weaker version of the hammer.
What has to be true
- It comes after a fall. The same shape in the middle of a rise, or in a flat stretch, is not a hammer and says much less.
- The lower wick is at least twice the length of the body. The longer the wick and the smaller the body, the more of the day's fall was bought back.
- There is little or no upper wick. A long one means sellers also won the top of the day, and the story is muddled.
What the shape records is a day on which sellers drove the price well down and buyers then took almost all of it back before the close. That is a real change in who won the day. It is still only one day.
The day after decides it
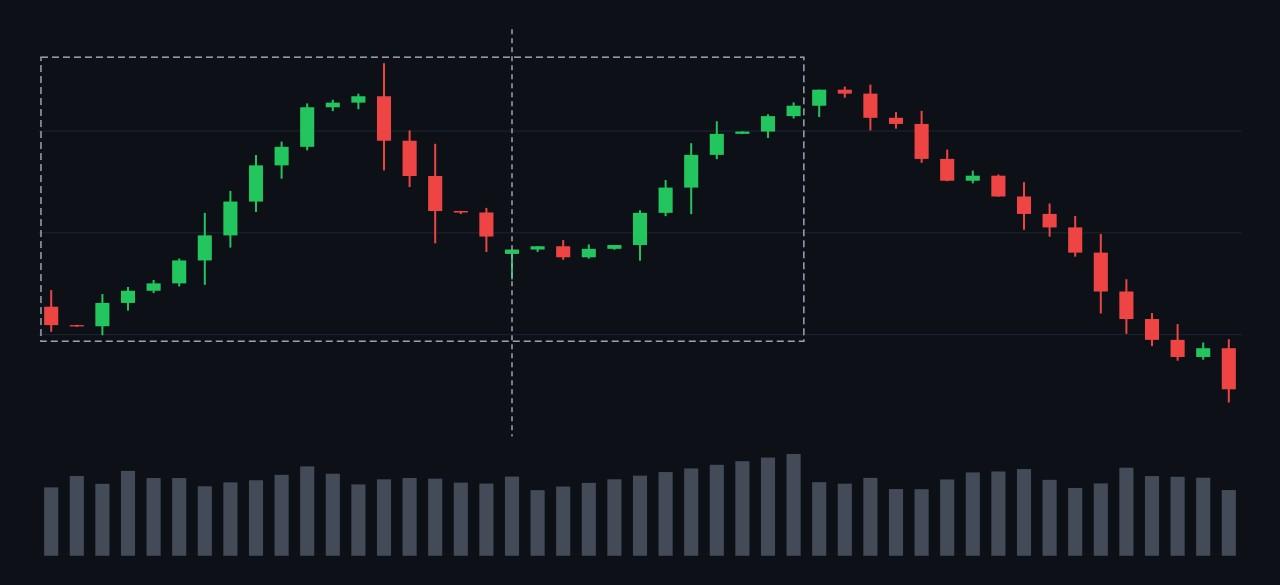
The hammer on its own says buyers turned up. The next candle says whether they stayed. If the next day closes above the hammer's high, buyers have carried the turn into a second day, and that is what people mean by confirmation. If the next day is a big red candle that closes well down, the fall has simply carried on, and the hammer was a pause.
Look at how this chart ends, too. The turn was real and the price did rise. It also gave all of it back later on. A hammer can mark the low of a move without saying anything about how long the next move lasts.
In this topic
A hammer at a price the share has turned at before, on heavy volume, says more than one in empty space.
Intermediate · 2 min
Enter on the confirming close, put the stop under the hammer's low, and size the trade so that stop costs what you planned.
Intermediate · 2 min
Try this in the app
- Research — open a share and read its daily candles
Share this lesson
Works with
- Candlestick charts — Each candle packs a whole day of trading into one shape.
- Candles that often mark a turn — A few shapes show up often enough at turning points to be worth recognising.
- Trends — A share in a trend keeps making higher highs, or lower lows — and most of the time it is doing neither.
- The hanging man — A small body on a long lower wick, after a rise — the same shape as a hammer, in the opposite place.