Making a hammer believable
Intermediate · 2 min
A hammer at a price the share has turned at before, on heavy volume, says more than one in empty space.
Most hammers lead nowhere. The ones people take seriously have something else going for them on the same chart. None of these make a hammer right. Each is a second reason, from somewhere other than the candle's shape.
- RSI
- Relative Strength Index. An indicator drawn under the chart that compares the size of recent up days with recent down days, usually over 14 days, on a scale of 0 to 100. Below about 30 the falls have been much bigger than the rises.
- bullish divergence
- The price makes a lower low but an indicator such as RSI makes a higher low. The fall is still going, but each new push down is weaker than the last.
- Where it forms. A hammer at a support level, a price where the share has turned up before, is the one most worth watching.
- Volume. Heavy volume on the hammer or on the next day means many people took part in the buying back, not a handful.
- A second candle shape nearby. An inverted hammer the day before, or a small-bodied candle, tells the same story twice.
- An indicator agreeing. A bullish divergence on RSI, or a turn up in MACD, says the fall was already losing force.
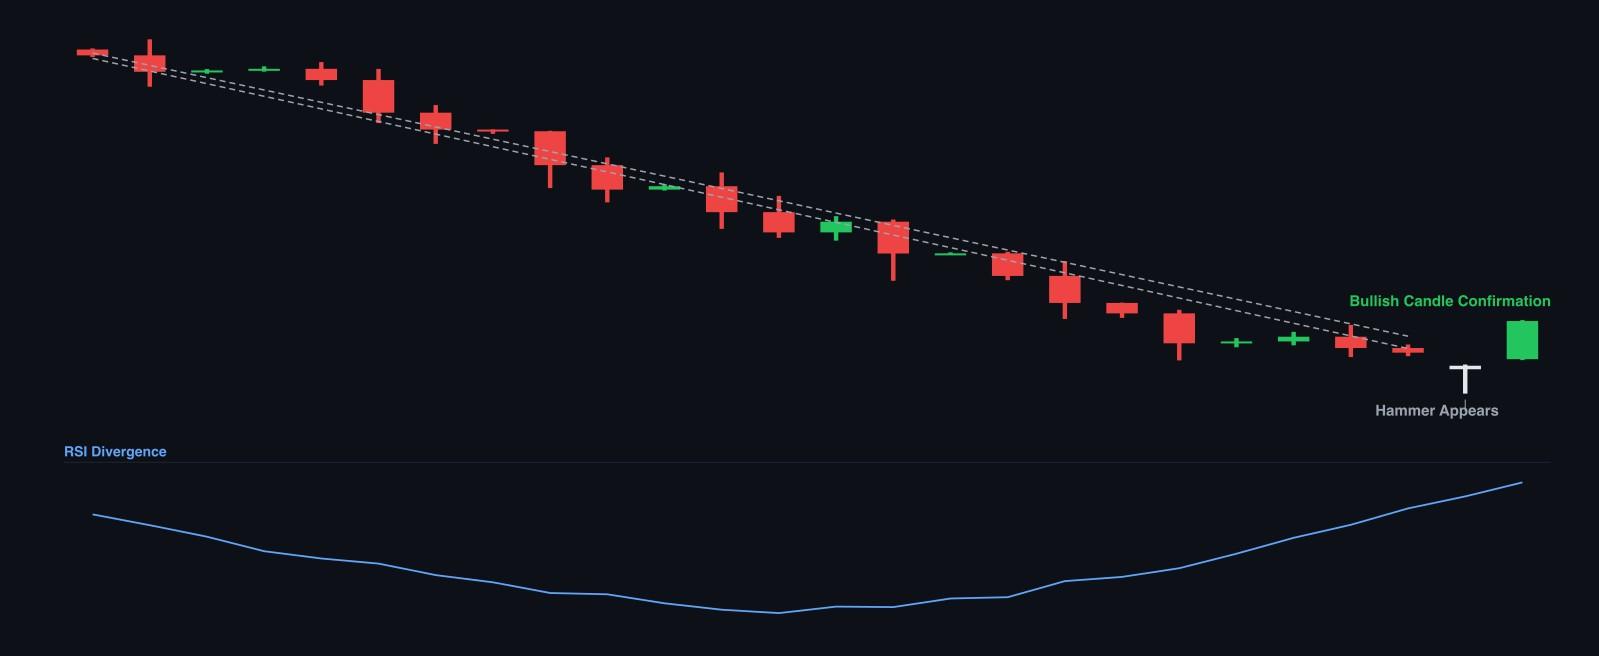
This example lines up three things. RSI had been making higher lows for weeks while the price kept falling. An inverted hammer and then a hammer came at the bottom. The next day closed well above both. A trader using this method would enter at that close, not on the hammer itself.
Share this lesson
Works with
- Support and resistance — Prices where a share has repeatedly stopped falling, or stopped rising.
- Key points and breakouts — Some prices matter more than the rest, and a share that clears one is telling you something.
- Telling a trend from noise — Trend lines and moving averages both describe what has already happened.