Waiting for confirmation
Intermediate · 3 min
A price that pokes above a key point and falls straight back has told you the opposite of what it looked like.
The hard part of a key point is not choosing it. It is the hour on the day the price reaches it, when the share is above your line and you do not yet know whether it will still be there at the close. Three pictures cover almost everything you will see.
A break that held
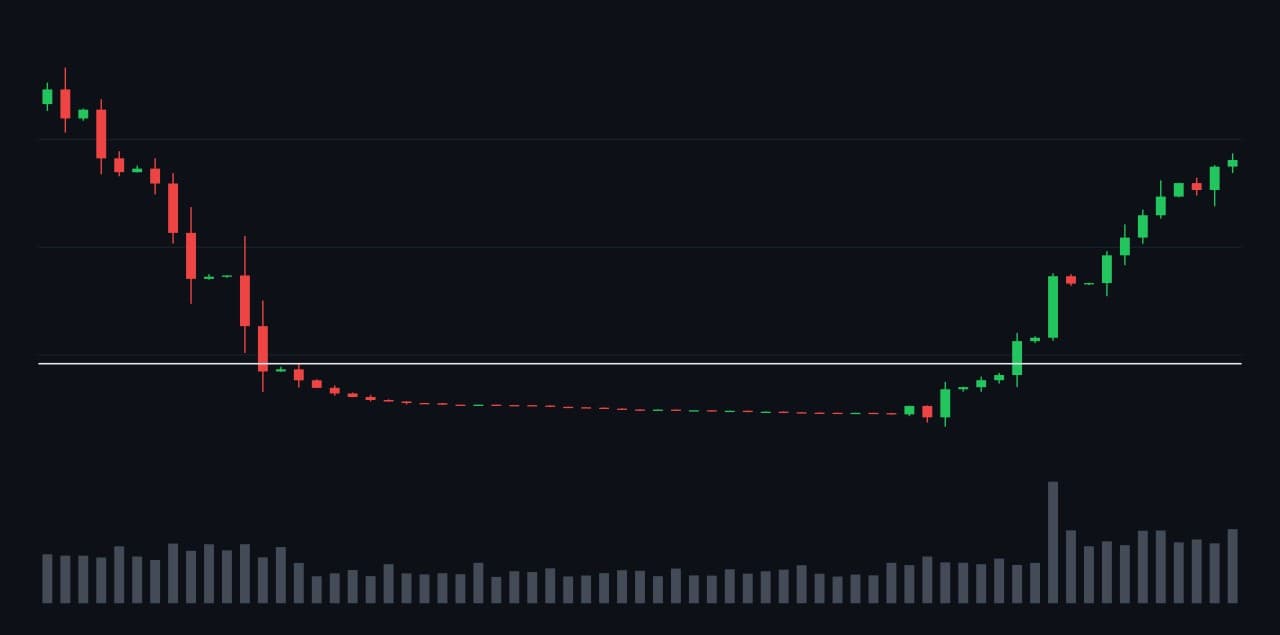
Two things happened together here. The share closed above the level rather than touching it, and far more shares changed hands than on a normal day. Volume matters because a move made by a handful of trades is easy to reverse, and a move the whole market took part in is not. Neither of those is a promise. Both are things you can see rather than infer.
A break that failed
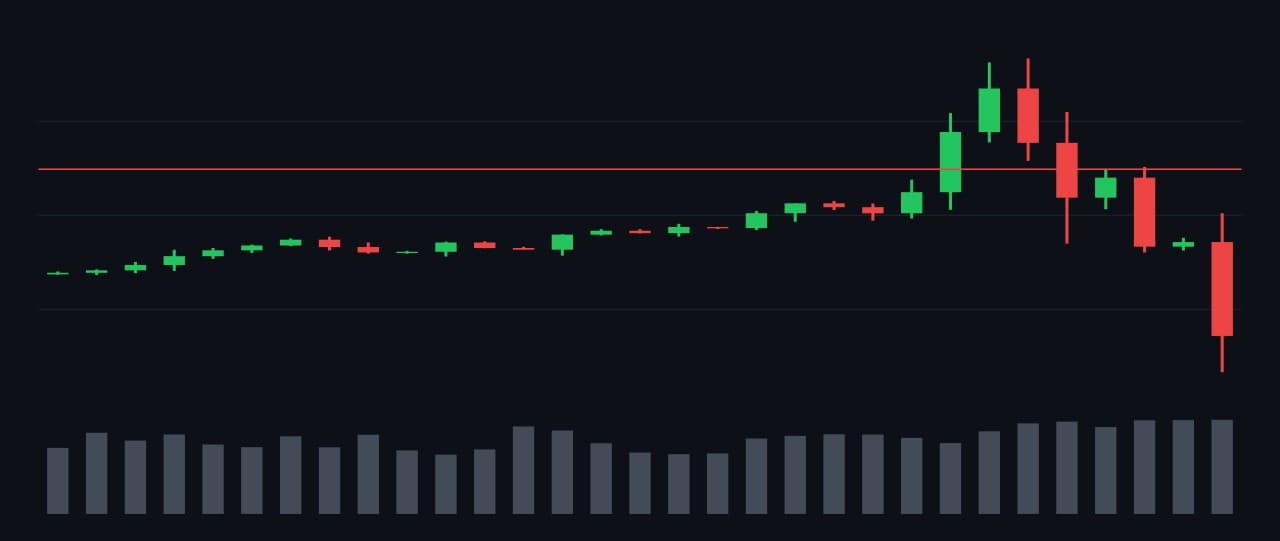
This is the ordinary case, and it is why the waiting exists. The price went above the level and did not stay. Everybody who bought during the poke is now holding a share that is weak by their own definition. If you had a rule that says buy on the close above the line, you never bought — the close never came.
The pullback that holds
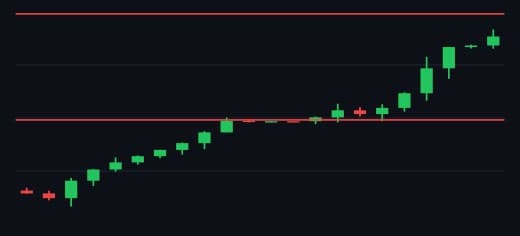
A share that clears a level rarely goes straight up. It usually comes back to the level it just cleared. The distinction that matters is whether it closes back under it. Coming back to the old ceiling and holding above it is the ordinary, healthy version of this — the level that used to stop the price is now the floor it stands on. Closing back under it is the failed case above, arriving a few days late.
A ₹500 key point, with ₹1,00,000 to put in
- Key point, chosen a fortnight earlier
- ₹500
- Close on the day it broke
- ₹512
- Volume that day, against its usual
- about three times
- Shares bought at ₹512
- 195, costing ₹99,840
- The price that says you were wrong
- a close back below ₹495
- Risk per share
- ₹17
- Most you lose if it fails
- ₹3,315, about 3.3% of the stake
Every line except the middle two was decided before the share did anything. That is the whole reason for the exercise: on the morning it breaks you are reading numbers you already agreed to, not inventing them while the price moves.
The exit at ₹495 is a stop loss, and where exactly to put it is a lesson in itself. Just below the level you bought for is the common choice, because a close back under it has removed the reason you bought.
Try this in the app
- Research — check a share's closing prices and daily volume
Share this lesson
Works with
- Support and resistance — Prices where a share has repeatedly stopped falling, or stopped rising.
- Stop losses — The price you decide, before you buy, at which you will admit you were wrong.
- Head and shoulders bottom — Three lows, the middle one deepest, and a line across the bounces between them that the price has to close above.
- Ground volume — When trading in a share dries up to almost nothing, the quiet itself is information.
- Buying after it goes quiet — Three rules people use to act on ground volume, and why none of them tells you the bottom.